Taking the Long Way Home August 14th, 2009
Patrick Stein

I was pondering non-deterministic, shareware nagging. Suppose that every time you performed a particular function, I wanted to randomly decide whether to nag you this time or not. Suppose further that I’d prefer not to have to keep track of how long it’s been since I last nagged you, but I’d still like you to be nagged about once every n times. Naïvely, one would expect that if I just chose a random number uniformly from the range zero to one and nag if the number is less than \frac{1}{n}, this would do the trick. You would expect that if you rolled an n-sided die each time, that you’d roll a one about every n-th time.

Me, I’ve learned to never trust my naïve intuition when it comes to probability questions. Well, it turns out that the naïve answer is perfectly correct in this case. Here is the epic journey I took to get there though.

Here’s what I wanted. I wanted to know the probability p needed so the expected number of trials until the first success is some number n given that each trial is independent and is successful p proportion of the time. Suppose for a moment that I decided I am going to roll a six-sided die until I get a one. What is the expected number of times that I need to roll that die to get my first one? What I want here is the inverse problem. How many sides should my die be if I want it to take n tries (on average) to get my first one?

tree In the picture at the right, each circle represents a trial. Each square represents a success. What I am looking for is what value should I pick for p so that if you go left p proportion of the time and go right the other (1-p) proportion of the time, you will expect to hit n circles along your descent. You could, if very unlucky (or lucky in this case since I’m going to nag you) go forever to the right and never get to a rectangle. So, already, we’re expecting an infinite sum.

Indeed, the expected number of circles you cross in a random descent of this tree is E(p) = \sum_{k=1}^{\infty} k \cdot p \cdot (1 - p)^{k-1}. Massaging this a little, we can get it into a simpler form: E(p) = \frac{p}{1-p} \sum_{k=1}^{\infty} k \cdot (1 - p)^k.

That infinite series is pretty nasty looking though. So, we whip out a handy table of infinite series and see that:

\sum_{k=1}^{\infty} k^m q^k = \frac{1}{(1-q)^{m+1}} \sum_{k=0}^m \left[ \sum_{j=0}^{k+1} (-1)^j { {m+1} \choose j } (k - j + 1)^m \right] q^{m-k}

Fortunately, in our case, m = 1. As such, we can reduce this significantly:
\frac{1}{(1-q)^2} \sum_{k=0}^1 \left[ \sum_{j=0}^{k+1} (-1)^j { 2 \choose j } (k - j + 1) \right] q^{1-k}

\frac{1}{(1-q)^2} \left\{ \left[ \sum_{j=0}^1 (-1)^j { 2 \choose j } (1 - j) \right] q + \left[ \sum_{j=0}^2 (-1)^j { 2 \choose j } (2 - j) \right] \right\}

Now, we note that when j = 2, the last summand is zero. So, \sum_{j=0}^2 (-1)^j { 2 \choose j } (2 - j) = \sum_{j=0}^1 (-1)^j {2 \choose j } (2 - j). As such, we can combine our two summations into one:
\frac{1}{(1-q)^2} \sum_{j=0}^1 (-1)^j { 2 \choose j } \left[ (1 - j) q + (2 - j) \right]

And, since j is only going from zero to one, it’s easy enough to write out both terms of the summation:
\frac{1}{(1-q)^2} \left\{ { 2 \choose 0 } \left[ q + 2 \right] - { 2 \choose 1 } \right\}

\frac{1}{(1-q)^2} \left\{ q + 2 - 2 \right\}

\sum_{k=1}^{\infty} k q^k = \frac{q}{(1-q)^2}

Whew! Big sigh. We’re through the ugly parts. Now, in our case, q = (1-p), and the equation we were interested in was E(p) = \frac{p}{1-p} \sum_{k=1}^{\infty} k \cdot (1 - p)^k. Plugging in (1-p) for the q in our infinite series solution, we find that

E(p) = \frac{p}{1-p} \cdot \frac{1-p}{p^2} = \frac{1}{p}

Two pages of ugly, ugly algebra bears out the simple guess. Wheee! If we want E(p) = n, then we have to pick p = \frac{1}{n}. Hooray!

Ask a simple question… August 8th, 2009
Patrick Stein

Ask a simple question, spend the next forty minutes sifting through integral tables. Earlier, I took some code that was uniformly selecting points from a square centered at the origin and converted it to code using points from a normal distribution. For my purposes, I used a standard-deviation for the normal distribution that was half of the in-radius of the box. It wasn’t at all exact in any way.

What if I wanted to be exact? Suppose I wanted to switch from points uniformly distributed in a box to points from a normal distribution while maintaining the expected distance from the selected point to the origin.

What exactly is the expected distance from a selected point to the origin if one picks each coordinate for the point from a uniform distribution on the range [-1,+1]? Let’s start with the one-dimensional case. The probability density is \frac{1}{2} everywhere. So, the answer is 2 \int_{r=0}^1 \frac{1}{2} r dr = \frac{1}{2} as we would expect.

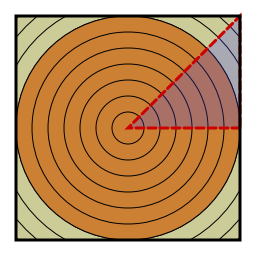
(image created in Lisp using Zach's Vecto library)How about two dimensions? This is immediately more awkward. The one-dimensional disk looks exactly like the one-dimensional square. In two dimensions, the disk and square are quite different. We either have to integrate over the square and calculate the radius of each point, or we have to integrate over increasing radii and be careful once we get to the in-radius of the square. (image created in Lisp using Zach's Vecto library)
I originally chose to try to integrate over the square. The probability density is \frac{1}{4} everywhere. This means the expected radius is \int_{y=-1}^1 \int_{x=-1}^1 \sqrt{x^2+y^2} dx dy. This gets to be no fun very fast since the inner integral comes out with a logarithm in it. I mean, do you want to finish this integral?

\int_{y=-1}^1 \left.\left( \frac{1}{2} x \sqrt{x^2 + y^2} + \frac{1}{2} y^2 \ln \left( x + \sqrt{x^2 + y^2} \right)\right)\right|_{x=-1}^1 dy

It may be easy. I didn’t want to mess with it. I suppose once you evaluate the x terms, it reduces a fair bit (if I did that all right):
\int_{y=-1}^1 \left( \sqrt{1 + y^2} + \frac{1}{2} y^2 \ln \left( \frac{1 + \sqrt{1 + y^2}}{-1 + \sqrt{1 + y^2}} \right) \right) dy

I still don’t want to touch it.

So, how about integrating over the radii? Again, the probability density is \frac{1}{4} everywhere. This makes the expected radius:

\int_{r=0}^1 \frac{1}{4} \cdot 2 \pi r dr + \int_{r=1}^{\sqrt{2}} \frac{1}{4} \cdot 8 \left( \frac{\pi}{4} - \arccos \frac{1}{r} \right) dr

With a little massaging, you can move the \frac{\pi}{4} from the second integral into the first instead:
\int_{r=0}^{\sqrt{2}} \frac{1}{4} \cdot 2 \pi r dr - \int_{r=1}^{\sqrt{2}} \frac{1}{4} \cdot 8 \arccos \frac{1}{r} dr

This is hardly consolation though. Here is where we get lost in our table of integrals for the better part of an hour.

And, this is only the two-dimensional case! In my original problem, the ambient space was 32-dimensional. My, oh my.

Axiom of Choice Joke: Now for Sale August 7th, 2009
Patrick Stein

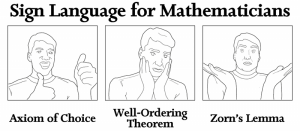
There’s an old math joke that goes like this: The Axiom of Choice is obviously true. The Well-Ordering Theorem is obviously false. And, Zorn’s Lemma is just too complicated to be sure. It is a joke because it is easy to prove that they are equivalent.

MathSignLang For a month now, I have wanted to turn that joke into a Sign Language for Mathematicians picture. I finally got to it this evening. You can see the result on the right.

You can purchase it on a t-shirt or mug over at Zazzle, if you like.

The intuition

I am going to try to paraphrase the Axiom of Choice, the Well-Ordering Theorem, and Zorn’s Lemma to try to give you a sense of why each statement in the joke seems intuitively correct.

Suppose that I have infinitely many boxes. Each box contains one red ball and one blue ball. You can, with or without the Axiom of Choice, pick one ball from each box unless you are colorblind. If you are colorblind, you need the Axiom of Choice to pick one ball from each box even if you don’t care what color that ball is. What a wacky world it would be if a colorblind person could not pick a ball from each of these boxes. So, obviously, the Axiom of Choice should be true.

Suppose you have all of the real numbers from zero to one including both zero and one. If I asked you to give me the smallest number you’ve got, you could hand me the zero. Now, if I asked you to give me the smallest number you’ve got, you’re stuck. What the Well-Ordering Theorem says is that there is some way we could sort your collection of numbers so that no matter how many of them I take away (so long as I don’t take them all), you will never get stuck. It seems crazy that you can just shuffle your collection of numbers to keep me from thwarting you.

As the joke mentions, Zorn’s Lemma is complicated. On the one hand, Zorn’s Lemma says that if you took the genealogy of all people born in the last 8,000 years, then there exists at least one person with no ancestors born in the last 8,000 years. On the other hand, Zorn’s Lemma says that you didn’t need to shuffle your numbers so that you could still give me the smallest number in your hand after I took away the zero.

How it looks on a t-shirt

90% Accuracy Fails July 27th, 2009
Patrick Stein

Bruce Schneier pointed out this BBC News article about the base rate fallacy. In that article, they consider a Terrorist Detector that is right 90% of the time. Given that the test signals a positive for someone, how sure are you the person in question is a terrorist?

The gist of the math

Well, the math in that article is confusing. They say the answer is about 0.3%. But, they later do a diagram that makes it look like 1 in 100,000 to me. Further, they tacitly assume that while 10% of the time the test will identify a non-terrorist as a terrorist, it will never miss a real terrorist.

Regardless, the goal of the article is to show Bayes’s Theorem in action for something that has a low prior probability. In layman’s terms, if something is really, really unlikely, then you are very bad off if your test is only really good. It’s really unlikely that any given person is a terrorist. As such, if your test thinks every tenth person is a terrorist, your test is almost never right when it thinks it has found a terrorist.

In the article, they ask for help describing this fallacy in ways that will drive the point home to people on a gut level. I can kind of see how one could miss the idea in cancer screening. But, with terrorism?

The real world

Remember the last time you were on a plane? [Okay, I do… it was last Thursday.] You were sitting there with about a hundred fellow passengers. How many of them do you think were terrorists? My guess is that you were pretty sure (even before the flight took off) that zero of them were terrorists. How many of them bombed your flight? I’m pretty sure that number was zero (and not just because you wouldn’t be reading this otherwise). How many of you did the test think were terrorists? About ten.

What proportion of hundred-passenger flights would the test think are terrorist-free? Fewer than one in every 35,000 flights. Buy a lottery ticket if you’re on a flight where this (hypothetical) test thinks there are no terrorists because it just may be your lucky day.

To do the full analysis, you have to consider how many of those 35,000 flights really do have terrorists on them. But, it should be blatantly obvious to everyone that the answer is way, way under 34,999.

What is a terrorist, anyway?

This brings up another question that I always have when people start talking about detecting terrorists or the number of terrorists in the U.S., etc. When is someone a terrorist? If Khalid Sheikh Mohammed were traveling to Hawaii for some R&R, is he a terrorist? would the test detect him? should he be allowed on the plane?

Detecting terrorists is often talked about like detecting diseases and such. But, really, it is about detecting intentions. Intentions are far more evanescent than microbes.

“Visualizing Quaternions” by Andrew J. Hanson July 10th, 2009
Patrick Stein

Sunday night, I finished reading Visualizing Quaternions by Andrew J. Hanson. Unfortunately, the events of the week have kept me from writing this summary sooner. I feel like it would have been longer had I written it Monday. Alas, let’s play the cards in front of me.

This is a wonderful book. In addition to having gobs and gobs of useful content, it is a fine specimen of book design. The layout and illustrations are tremendous.

It tends to go from well-written, conversational passages that explain things in great detail to terse passages that mean nothing if you’re not a tensor-analysis whiz. But, even if you skim the parts that assume you know things you don’t, there’s still lots of book here to read.

There is even a nice appendix about Clifford algebras which folds in nicely with the complex number, quaternions, Clifford algebra posts that I’ve made here recently. If you do three-dimensional simulations or you like a good mathematical read, you should give this book a look.

l