Fourier Transform of Swarm Data with HUD September 25th, 2009
Patrick Stein

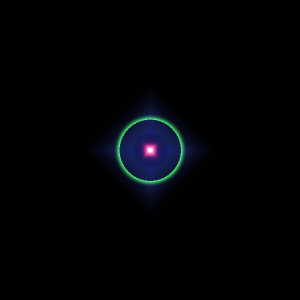
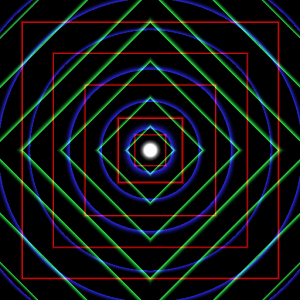
I added a heads-up display to the code from the previous article. This display shows you the coordinates of each of the bees.

The leader-bee is thick white string with green beads. The follower-bees are the thin black strings with red beads. Going clockwise from the top, the beads on each string represent amplitude, x-frequency, y-frequency, x-phase, and y-phase. The outside of the HUD represents positive infinity. The inner circle of the HUD represents negative infinity. The light yellow circle between the infinities represents zero. Note: the scaling is extreme. Two is almost 90% of the way from zero to infinity on this scale.

Fourier Swarm with Bee Display from Patrick Stein on Vimeo.

Technical details of the HUD scaling

Say you have a number m that you want to map into the interval [-1,1]. Draw the upper half of the unit circle centered at the origin. Start moving from left to right along the circle until you find the spot with a tangent of slope m. Use the x-coordinate of this point. To map that interval onto my HUD, subtract your calculated x-coordinate from two and use the result as the radius from the center of the HUD.

Here is the Lisp source code. It depends on Zach’s Vecto library.

Edit: Oops… there is a bug in the HUD code. The leader and first follower are not shown. The second follower is the thick white line. Ooops. Okay… I have replaced the video and the source code now.

Inverse Fourier Transform of Swarm Data September 24th, 2009
Patrick Stein

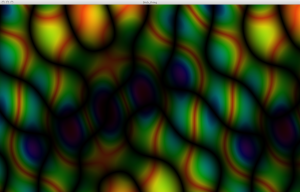
Inspired by Neil Baylis‘s Blob Thing program that I talked about previously, I made some Fourier Transform art of my own.

Take a leader-bee in five-dimensional space. Give him a place to go in five-dimensional space. When he gets close to his destination, move his target spot. Have ten follower-bees try to follow him. The follower-bees can fly faster than the leader bee. They are also super eager. They always accelerate at their maximum possible acceleration.

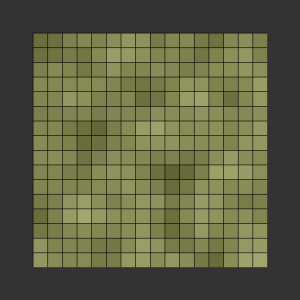
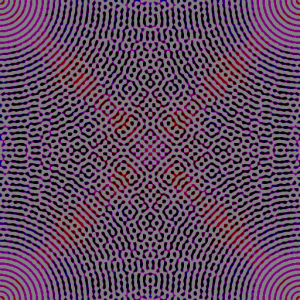
Now, for each follower-bee, consider how far away it is along each axis from the leader-bee. Interpret those deltas as an amplitude, a horizontal frequency, a vertical frequency, a horizontal phase angle, and a vertical phase angle. Compute the inverse 2-D Fourier transform of those components from the follower-bees.

Color code the output by the height. Add in some specular highlights. Animate through time.

Fourier Swarm from Patrick Stein on Vimeo.

I have used a similar technique in the past to generate ambient music. There, I made twenty follower-bees in thirty-two dimensions and used the average distances along each axis to the leader-bee as the volume of the note (each axis had a different pitch). Here, the results are visual instead of aural. I also cannot generate them in realtime except for very tiny sizes. *shrug*

Here is the Lisp source code. It depends on Zach’s ZPNG library for output.

Beautiful Random FFTs September 22nd, 2009
Patrick Stein

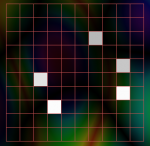
Neil Baylis emailed me a program he had put together that puts a few random numbers in a grid and does the inverse FFT of them. His program cycles the values placed in the grid between -1 and 1 to animate some different effects. I like just regenerating random ones over and over again or tweaking which cells of the grid are in use. [You may already be on the same page as I am here, but I’ve got an idea kicking around now that I just have to try…. watch for it in a day or two.]

blob_thing Here is one of the nifty designs that I generated with his program. I encourage you to download it and play around a little bit. It is really great to see in real-time how activating certain frequencies affects the output.

For reference, blob_thing_grid here are the frequencies that I had activated for the above picture.

There are gorgeous specular features and shading in his output images. He could have just it left it flat-colored, but he went the extra distance to add a lighting model. The results are stunning. You should click on the above image to see it full-size. And, you should check out the the example on Neil’s page.


Blur and Edge Detect your Fourier Transforms September 21st, 2009
Patrick Stein

I have now added convolutions to my FFT Paint application. Here, I started with the following image (again, magnitude on the left and phase on the right):

conv_orig_m  conv_orig_p

From there, I took the Fourier Transform:

conv_pre_m  conv_pre_p

Then, I did a horizontal Sobel operator on it to get this:

conv_post_m  conv_post_p

From there, I did the Inverse Fourier Transform to obtain this:

conv_final_m  conv_final_p

Enjoy!

Do Radial Gradients on your FFT September 16th, 2009
Patrick Stein

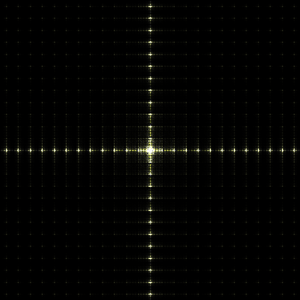
I have now added radial gradients to my FFT Paint application. Here, I wiped out an image entirely and painted my own data using only the new gradient tool to come up with this starting point:

mag_grad  phase_grad

This is what it looks like if I do the inverse FFT of that data. It’s not an incredibly interesting result, but it does show the power.

mag_inv  phase_inv

Here is another example of a starting point made entirely with the gradient paint tool:

conc_tm  conc_tp

And, its resulting image when I do the inverse transform:

conc_rm  conc_rp

l