Making Sudoku Diagrams in Lisp May 1st, 2022
Patrick Stein

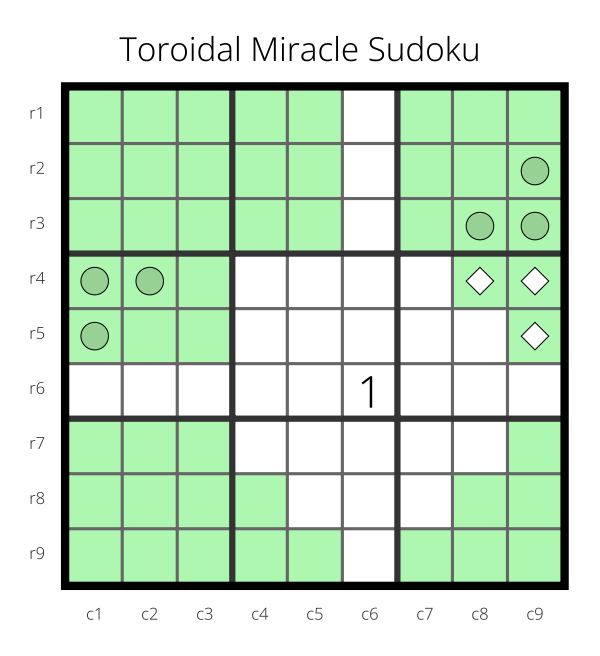
A few weeks ago, I was analyzing a Sudoku variant if the board were a flat torus instead of a square. I wrote a little paper about this analysis.

For that paper, I created the diagrams by taking screenshots of the f-puzzles Sudoku editor, pulling them into the GIMP image editor, cropping them all to the same dimensions, and pulling them into my document. I discovered a mistake that I had made throughout all of the images after I had already collected all of the screenshots. Rather than fixing the mistake by doing a new screenshot, I fixed things in the image editor instead of in the Sudoku editor.

It was painful.

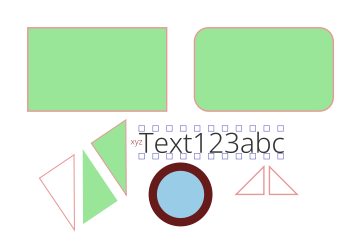
So, I decided to make a way to declare a diagram and then render it so that it can be modified/corrected rather painlessly.

My initial cut at this was in CL-PDF. I realized, when I had finished, that I had only used a small subset of CL-PDF and that almost all of that functionality was available in Vecto (with a tiny bit of help from ZPB-TTF which Vecto uses already).

This was all the motivation that I needed to finally start on a project that I’ve been hoping to do for years now. I wrote a compatibility library that takes something very, very close to the subset of CL-PDF that I used in the diagram and renders it either using CL-PDF or Vecto so that I can have the output as either a vector image or a raster image.

Sudoku diagram rendered showing different marking, highlighting, and labelling options of the SUDOKU-DIAGRAMS library

I’d like to extend this sometime to also output to CL-SVG, but the way that fonts are handled in SVGs might make that impossible for most things one would want to do with text in a diagram.

You can find the library here: https://github.com/nklein/sudoku-diagrams

DRAW v0.2.20220430 May 1st, 2022
Patrick Stein

I have released a new Lisp library. This library provides compatibility between CL-PDF and Vecto so that I can render the same drawing either as a vector drawing or a raster drawing.

This library forms an almost drop-in replacement for a small subset of CL-PDF and implements that subset with both CL-PDF and Vecto.

The functionality at the moment is somewhat limited. But, it is enough to make the Sudoku diagrams that I was working on. I had originally created the diagrams using CL-PDF. Then, I went through and wrapped them in one line of code and changed all of the PDF: package delimiters to DRAW: and ta-da. Diagrams.

Diagram showing various triangles, rectangles, and text to demonstrate the functions DRAW supports.

This is the current test image. It demonstrates all of the capabilities available at the moment.

You can find the library here: https://github.com/nklein/draw

Anamorphic Fun January 2nd, 2020
Patrick Stein

I want to make some bookshelf dioramas like these ones by Monde. I also want to make some that take more liberties with the limited space available. So, I am thinking about using forced perspective to create extra depth. I’m also thinking of some designs that could use right-angled mirrors to snake height into depth.

I also want to create extra width (and height) though. Not just depth. How can I do that? I can use anamorphic illusions to make things appear to stretch beyond the edges of the box. And, I can force the viewer to only view it from the illusory angle and enhance the illusion of space if I make the diorama viewable through a peephole.

So, I started experimenting yesterday with anamorphic projection onto the inside of a narrow box for viewing through a peephole.

I used the cl-svg to create grids like this that look flat when viewed (from the correct distance) through the peephole linked above.

Then, I used cl-jpeg to create images that when printed and folded into the interior of a diorama look as if the image extends beyond the sides of the diorama.

If you print this as 72dpi and then fold on the white lines, it will look like a flat, square image with the letters AB on it when you look down into it.

Then, I combined the two.

If you print this as 72dpi and then fold on the white lines, it will look like a flat, square image with the letters AB on it when you look down into it through a 200-degree peephole.

Here is the full source code (peephole.lisp) used to generate the grid and the anamorphic images.

Fog of Light – Starting to Add Star-Fields May 28th, 2017
Patrick Stein

I have finally written my first OpenGL code using GLSL. Whew. That took way too long to get all working correctly. I promise, soon, I will upload some sample code so that others may not have to stumble as long as I did.

For the star-field, I generate a few thousand 2-D points. Each point has its own radius, its own opacity, and its own color.

I put these all into an OpenGL array buffer. Then, the vertex shader copies data out of my struct to set the color and the point size. Then, the fragment shader turns the color into two, overlapping radial gradients (one that is half the radius of the other) by modulating the color’s opacity.

screenshot of sample starfield

Next up will be nebulae, then planets/asteroids in the local system.

Fog of Light – Getting Underway May 15th, 2017
Patrick Stein

Dauntless (The Lost Fleet, Book 1) was the first science-fiction book I read that tried to deal with space combat with the real-world constraint that light only travels so fast. It takes light eight minutes to get from the Sun to Earth. It takes light more than a second to get from the Earth to the Moon. Depending on where they are in their orbits, it takes between three minutes and twenty-two minutes to get light from Mars to Earth.

Imagine that you’re a star-ship. You and your companions have just warped into a new star system. You see a flotilla of enemy ships about 45 light-minutes away. That means, you’ve got 45 minutes before that flotilla can possibly even know that you’re in their star system. How much can you get done in that time? Once they can see you, how much can you mislead them on your target if they’re going to be operating on data about where you were heading more than half an hour ago?

For years, I have been batting around this concept, hammering it into a game. I have finally gotten started on it.

Armed with some functions like these, I am constructing values which change at points in space-time and querying the value visible from other points in space-time.

(defgeneric get-nearest-value (space-time-value space-time-point)
  ...
  (:documentation "Find the observable value of a quantity
SPACE-TIME-VALUE when observed from a given location
SPACE-TIME-POINT. This method finds the most-recent
value V0 (at location P0) for this data when viewed from
the given location. This method returns (VALUES V0 P0).
This method makes no effort to interpolate the results."
))

Here are my first, visually-demonstrable results:

Hopefully, there will be plenty more coming in the near future.

l