Finding the Perfect Hyperbola February 15th, 2010
Patrick Stein

For an application that I’m working on, I needed a way to scale quantities that range (theoretically) over the real numbers (though practically are probably between plus and minus three) into positive numbers. I wanted the function to be everywhere increasing, I wanted f(0) = 1, and I wanted control of the derivative at x = 0.

The easy choice is: f(x) = e^{\alpha x}. This is monotonically increasing. f(0) = 1 and f^\prime(0) = \alpha.

I needed to scale three such quantities and mush them together. I thought it’d be spiffy then to have three different functions that satisfy my criteria. The next logical choice was f(x) = 1 + \mathrm{tanh} (\alpha x). It is everywhere positive and increasing. And, it has f^\prime(0) = \alpha.

Now, I needed third function that was always positive, always increasing, had f(0) = 1 and f^\prime(0) = \alpha. One choice was: f(x) = e^{e^{\alpha x} - 1}. But, that seemed like overkill. It also meant that I really had to keep my \alpha tiny if I didn’t want to scale things into the stratosphere.

Playing with hyperbolas
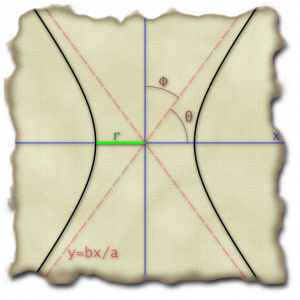
So, I thought… why don’t I make a hyperbola, rotate it, and shift it so that the apex of one side of the hyperbola is at (0,1). And, I can adjust the parameters of the hyperbola so that f'(0) = \alpha. After a variety of false starts where I tried to keep the hyperbola general until the very end (\frac{x^2}{a^2} - \frac{y^2}{b^2} = r^2, rotated by \theta degrees, and shifted by \beta), I quickly got bogged down in six or seven incredibly ugly equations in eight or nine variables.

So, it was time to start trying to make it easy from the beginning. I noticed that if was going to rotate it by an angle \theta in the clockwise direction, then I needed \phi = \frac{\pi}{2} - \theta to be such that \tan \phi = \alpha if my slope was going to work out right in the end. So, I’m looking at the basic triangle on the right then to determine all of my sines and cosines and such.
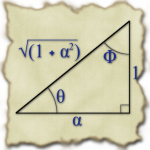
Based on that triangle, it was also obvious that the asymptote for my starting hyperbola had to have \frac{b}{a} = \frac{1}{\alpha}. I played around a bit then with making a = \alpha and b = 1. In the end, I found things simplified sooner if I started with a = 1 and b = \frac{1}{\alpha}.

I also needed r to be such that the point (-r,0) rotate up so that its y-coordinate was 1. This meant that r \sin \theta = 1 or r = \frac{1}{\sin \theta} = \sqrt{1 + \alpha^2}.

So, my starting hyperbola then was: x^2 - \alpha^2 y^2 = 1 + \alpha^2.

From there, I had to rotate the x and y by \theta in the clockwise direction. This gave me:

(x\cos\theta - y\sin\theta)^2 - \alpha^2 (x\sin\theta + y\cos\theta)^2 = 1 + \alpha^2

A little multiplying out leads to:

(x^2\cos^2\theta - 2xy\sin\theta\cos\theta + y^2\sin^2\theta) \\ - \alpha^2(x^2\sin^2\theta + 2xy\sin\theta\cos\theta + y^2\cos^2\theta) = 1 + \alpha^2

From there, using cos^2\theta = \frac{\alpha^2}{1 + \alpha^2}, sin^2\theta = \frac{1}{1 + \alpha^2}, and \sin\theta\cos\theta = \frac{\alpha}{1 + \alpha^2}, we come to:

\frac{-2\alpha(1 + \alpha^2)xy + ( 1 - \alpha^4 )y^2}{1 + \alpha^2} = -2\alpha{}xy +  (1 - \alpha^2)y^2 = 1 + \alpha^2

The only step remaining was to shift it all over so that when y = 1, we end up with x = 0. Plugging in y = 1, we see that -2x\alpha + 1 - \alpha^2 = 1 + \alpha. That equation balances when x = -\alpha. We want it to balance when x = 0, so we’re going to substitute (x - \alpha) in place of the x in the above equation to get:

-2\alpha(x - \alpha)y + (1 - \alpha^2)y^2 = 1 + \alpha^2

We can easily verify that the point (0,1) is on the curve. And, we can implicitly differentiate the above to get:

-2\alpha(x - \alpha)\frac{dy}{dx} - 2\alpha{}y + 2(1 - \alpha^2)y\frac{dy}{dx} = 0

Plopping x = 0 and y = 1 in there, we find that \frac{dy}{dx} = \alpha.

This is pretty good as it goes. The only step is to complete the square to find a nicer expression for y in terms of x. We start by adding \left[ \frac{\alpha}{\sqrt{1 - \alpha^2}} (x - \alpha) \right]^2 to both sides to get:

\left[ \sqrt(1 - \alpha^2)y - \frac{\alpha}{\sqrt{1 - \alpha^2}(x - \alpha)} \right]^2 = 1 + \alpha^2 + \frac{\alpha}{1 - \alpha^2} (x-\alpha)^2

This is easy enough to solve for y by taking the square root of both sides and shuffling some things about:

y = \frac{\alpha}{1 - \alpha^2}(x - \alpha) + \frac{1}{\sqrt{1 - \alpha^2}} \sqrt{1 + \alpha^2 + \frac{\alpha^2}{1 - \alpha^2}(x - \alpha)^2}

Here are all three curves with \alpha = \frac{1}{4}. The exponential is in black, the hyperbolic tangent is in red, and the hyperbola is in blue:

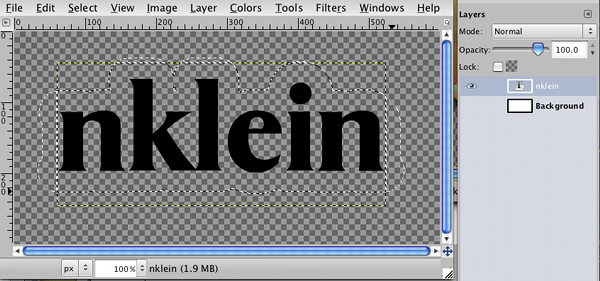
The first image on the page here was made with Zach’s Vecto library with some post-processing in the GIMP. (Here is the source file: hyperbola.lisp.) The second image was made entirely within the GIMP. And, the last image was made using Foo Plot and the GIMP.

Speedy iPhone App Programming February 4th, 2010
Patrick Stein

Sunday, I decided that I needed a simpler statistics tracking program to keep track of stuff while I’m coaching volleyball. I started out keeping them on paper, but felt that I was staring at the page too often to find where to put a tick mark.

Next, I tried the iVolleyStats Match iPhone app. It is pretty reasonable to use, but it’s got too many controls on the user-interface. The only way that I could keep up with a match was to forgo half of the functionality… either ignoring who is getting credit for an act, ignoring passing stats altogether, and not recording attack or block attempts at all.

For the past few weeks, I have tried using the Voice Memos application on the iPhone. I narrate the game into my phone as the game goes on. This lets me get really fine resolution of statistics, but it doesn’t give me any information in real-time. When I call a time-out, I am going from memory to say how we’ve been passing or hitting. This takes away the lion’s share of the benefit one gets from gathering statistics at all.

So, my team has a tournament this Saturday. I decided Sunday night that I should try to get together an iPhone app that does what I want. I’ve long been thinking about what I want in a volleyball stat tracking iPhone app. What I want will be a big, big undertaking (read: longer than one week). So, I started studying Apple’s CoreData APIs on Sunday night and Monday morning. Then, I dove in.

Now, my previous application was based upon Cocos2D-iPhone. As such, it didn’t involve any of the Apple UIKit classes or any work with Interface Builder. This application is navigation based with table views and custom table view cells from separate NIB files.

Despite this being my first real foray into the UIKit and CoreData APIs, I’ve got an application that I can use on Saturday. There are two more bits that I will try to add tomorrow, but that I don’t need for Saturday. To package it up for sale, there’s more functionality that I’ll need to add in case you don’t like things in the order that I have them on the screen or in case you want to add your own categories of statistic. And, I need to make some specialized visualization screens for some of the stats.

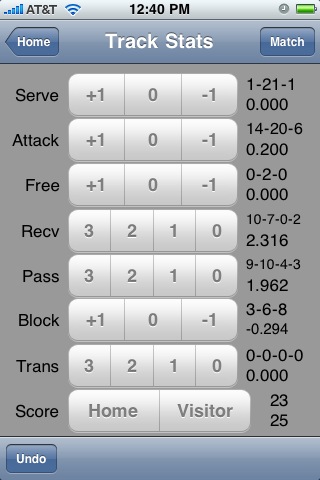
The screenshot here is the main stat-tracking interface. The stats present are Penn State’s stats from my trial run watching game one of their NCAA semifinal against Hawaii from last December. In retrospect, I think I probably gave them credit for two neutral attacks that I should have called free balls. Other than that, I think it’s pretty good. It’s definitely information that will do me well during time-outs.

I fought for a long time this morning trying to get my UIBarButtonItem to show up in my UINavigationBar for one screen. It turns out that these two methods don’t quite do the same thing on iPhoneOS 3.1.2:

// working version that shows my UIBarButton in the UINavigationBar
- (void)showStatTrackingScreen {
    [navigationController setViewControllers:[NSArray arrayWithObject:homeViewController] animated:NO];
    [navigationController pushViewController:trackStatsController animated:YES];
}

// version made of fail that does NOT show my UIBarButton in the UINavigationBar
// until you go forward a screen and pop back to this one.
- (void)showStatTrackingScreenMadeOfFail {
    [navigationController setViewControllers:[NSArray arrayWithObjects:homeViewController,
                                                                       trackStatsController,
                                                                       nil]
                                    animated:YES];
}

Spelling iPhone App sent to Beta Testers January 28th, 2010
Patrick Stein

I am pleased to say that I just sent my first iPhone app out to some friends to beta test. I expect to forward it along to Apple for inclusion in the App Store some time in the next week or two.

At this point, I am far more comfortable with Objective-C and the Cocoa class hierarchy than I was even a month ago. I still think Objective-C is awful. You take a nice functional Smalltalk-ish language, you throw away most of the functional, you pretend like you have garbage collection when you don’t, you strip out any form of execution control, you add some funky compiler pragma-looking things (including one called synthesize that only fabricates about half of what you’d want it to build), you change the semantics of ->, and then you interleave it with C! Wahoo! Instant headache!

But, after I found the for-each sort of construction, my code got quite a bit simpler. A whole bunch of loops like this:

NSEnumerator* ee = [myArray enumerator];
MyItem* item;
while ( ( item = (MyItem*)[ee nextObject] ) != nil ) {
   ...
}

went to this:

for ( MyItem* item in myArrayOrEnumerator ) {
   ...
}

Better Text Rendering with CL-OpenGL and ZPB-TTF January 19th, 2010
Patrick Stein

Last month, I posted some code for rendering text under CL-OpenGL with ZPB-TTF. Toward the very end of that post, I said:

Technically, that check with the squared distance from the calculated midpoint to the segment midpoint shouldn’t just compare against the number one. It should be dynamic based on the current OpenGL transformation. I should project the origin and the points and through the current OpenGL projections, then use the reciprocal of the maximum distance those projected points are from the projected origin in place of the one. Right now, I am probably rendering many vertexes inside each screen pixel.

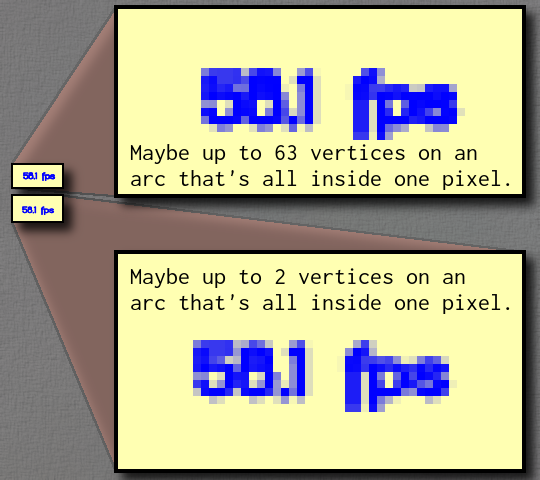
It was pretty obvious that when you tried to render something very small, it looked quite jaggy and much more solid than you would expect.


As you can see in the above image, the old version was placing up to 63 vertices for the same parabolic arc within a pixel. The new code is much more careful about this and will only place two vertices from a given parabolic arc within a pixel. You can see that in the upper rendering, the s is almost totally obliterated and the tiny bits sticking down from the 5 and 8 are much darker than in the lower rendering.

Here is the new code:

  • draw: better anti-aliasing
  • gl: smaller ‘frames-per-second’ indicator and some parameters to make it easier to toggle the main display
  • test: small tweak to make it work better under SLIME

Using a better cutoff value

The squared distance check that I mentioned now employs a cutoff value:

(defun interpolate (sx sy ex ey int-x int-y cutoff &optional (st 0) (et 1))
  (let ((mx (/ (+ sx ex) 2.0))
        (my (/ (+ sy ey) 2.0))
        (mt (/ (+ st et) 2.0)))
    (let ((nx (funcall int-x mt))
          (ny (funcall int-y mt)))
      (let ((dx (- mx nx))
            (dy (- my ny)))
        (when (< (* cutoff cutoff) (+ (* dx dx) (* dy dy)))
          (interpolate sx sy nx ny int-x int-y cutoff st mt)
          (gl:vertex nx ny)
          (interpolate nx ny ex ey int-x int-y cutoff mt et))))))

I have tweaked the (render-string …) and (render-glyph …) accordingly to propagate that value down to the interpolate function, and I have added a method to calculate the appropriate cutoff value.

Calculating the appropriate cutoff value

The appropriate cutoff value depends upon the font, the desired rendering size in viewport coordinates, and the current OpenGL transformations. The basic idea is that I prepare the OpenGL transformation the same way that I will later do for rendering the font; I will reverse-project (0,0), (1,0), and (0,1); I will calculate the distances from the reverse-projected (0,0) to each of the other two reverse-projected points; and then I will take half of that as my cutoff value. This effectively means that once the midpoint of my parabola arc is within half of a screen pixel of where the midpoint of a line segment would be, I just use a line segment.

(defun calculate-cutoff (font-loader size)
  (gl:with-pushed-matrix
    (let ((ss (/ size (zpb-ttf:units/em font-loader))))
      (gl:scale ss ss ss)

      (let ((modelview (gl:get-double :modelview-matrix))
            (projection (gl:get-double :projection-matrix))
            (viewport (gl:get-integer :viewport)))
        (labels ((dist (x1 y1 z1 x2 y2 z2)
                   (max (abs (- x1 x2))
                        (abs (- y1 y2))
                        (abs (- z1 z2))))
                 (dist-to-point-from-origin (px py pz ox oy oz)
                   (multiple-value-bind (nx ny nz)
                       (glu:un-project px py pz
                                       :modelview modelview
                                       :projection projection
                                       :viewport viewport)
                     (dist nx ny nz ox oy oz))))
          (multiple-value-bind (ox oy oz)
              (glu:un-project 0.0 0.0 0.0
                              :modelview modelview
                              :projection projection
                              :viewport viewport)
            (/ (min (dist-to-point-from-origin 1 0 0 ox oy oz)
                    (dist-to-point-from-origin 0 1 0 ox oy oz))
               2)))))))

Woolly Application Underway December 14th, 2009
Patrick Stein

I started building an application on top my Sheeple/CL-OpenGL library Woolly.

I coach a volleyball team. I often sit down with a piece of paper and try to determine new serve-receive and defensive positions for my team. This is quite tedious because I can’t just move the players around on the page. Additionall, I have to figure this out for all six rotations while keeping the overlap requirements in mind the whole time.

I tried once doing it with cut-out players. This worked better, but still suffered from having to track the rotations and overlap requirements all myself.

rotations After adding checkboxes to Woolly, I had a usable application for doing these rotations in 300 lines of code. Yellow are front-row players, blue are back-row players, and green are sidelined players. It still needs some work so that I can change player identifiers, substitute players in off the bench, save/load the rotations, and make print-outs.

I’m not sure yet whether I’m going to print just by slurping the OpenGL buffer into ZPNG, or if I am going to make a separate callback hierarchy for printing with Vecto or CL-PDF so that I can print at higher than screen resolution.

I’m also having trouble getting SBCL’s save-lisp-and-die function happy with the whole CL-OpenGL setup under MacOSX. I thought I had figured this out before. Alas, my own hacked version of CL-OpenGL isn’t working any better for me than the current CL-OpenGL release is when I try to run the saved image. *shrug* I’ll fight with that later.

Updates In Email

Email:

l